Charts
Make a chart
Section titled “Make a chart”- Optionally select the rows you want to chart. With nothing selected, all rows are used.
- Tap ⋯ → Chart.
- Pick a chart type from the strip at the top.
- Use the bar at the bottom:
- Labels: the column that names each point, for example Destination.
- Series: one or more columns of numbers to plot, for example Budget (USD). Each series can have its own colour.
- Size: the size of the exported image.
- Tap the pencil next to Chart to give it a title.
- Tap export (top right) to save it as an image and share it.
Saved charts are listed under Exported files on the home screen.
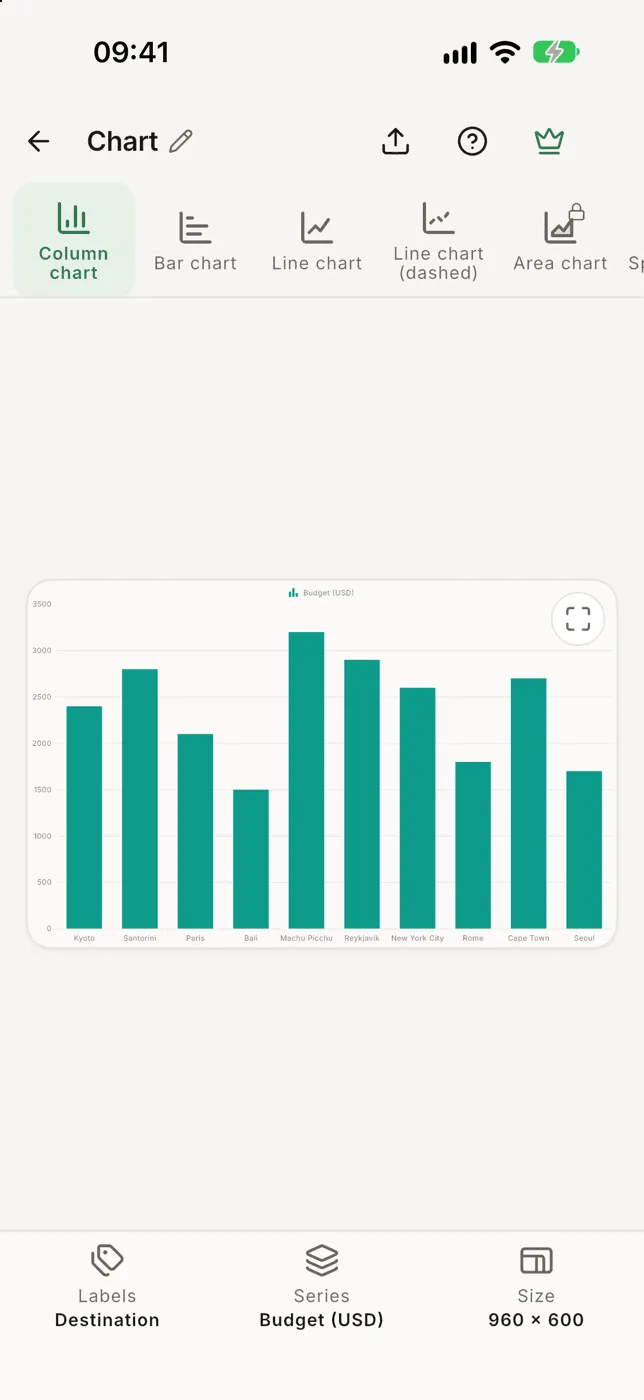
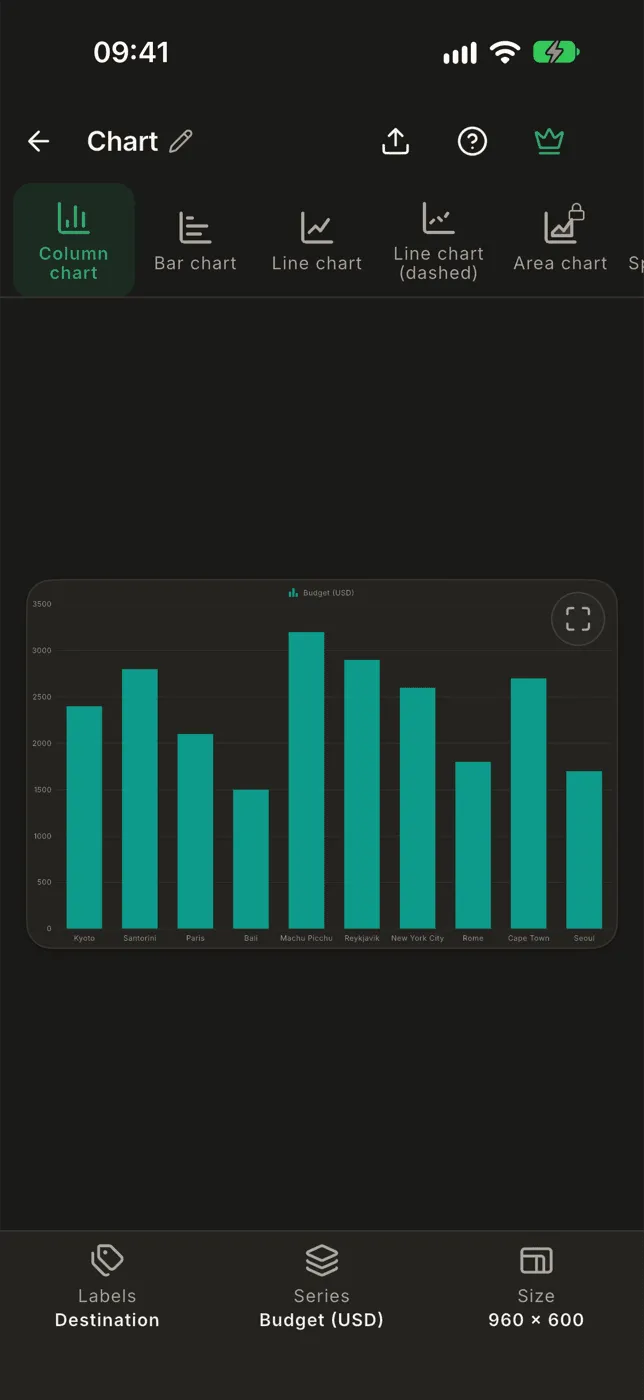
Chart types
Section titled “Chart types”Column, Bar, Line, Line (dashed), Area, Spline, Spline (dashed), Scatter, Step line, Step line (dashed), Step area, Pie, Doughnut and Pyramid.
Free and Pro
Section titled “Free and Pro”The free version makes column, bar and line charts from the first 10 rows. Pro unlocks every chart type and up to 1,000 rows.